The First Four Months of 2015 Are Characterized by
Continued Price Increases as Available Inventory Contracts
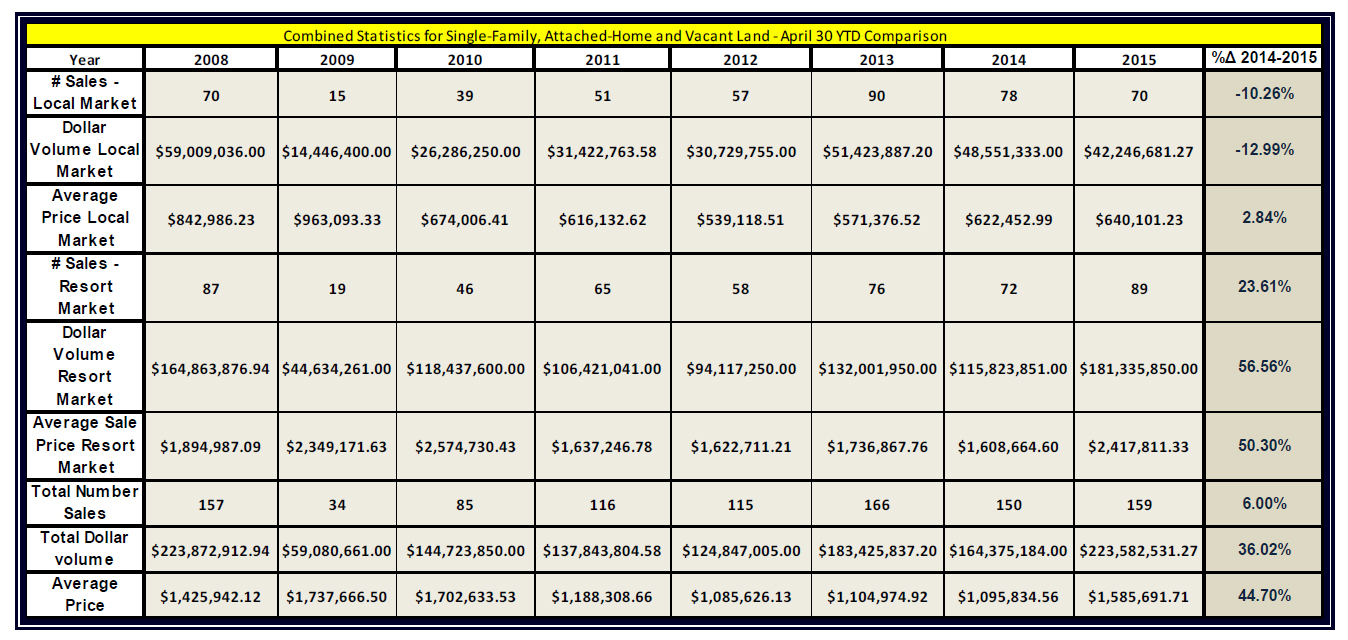
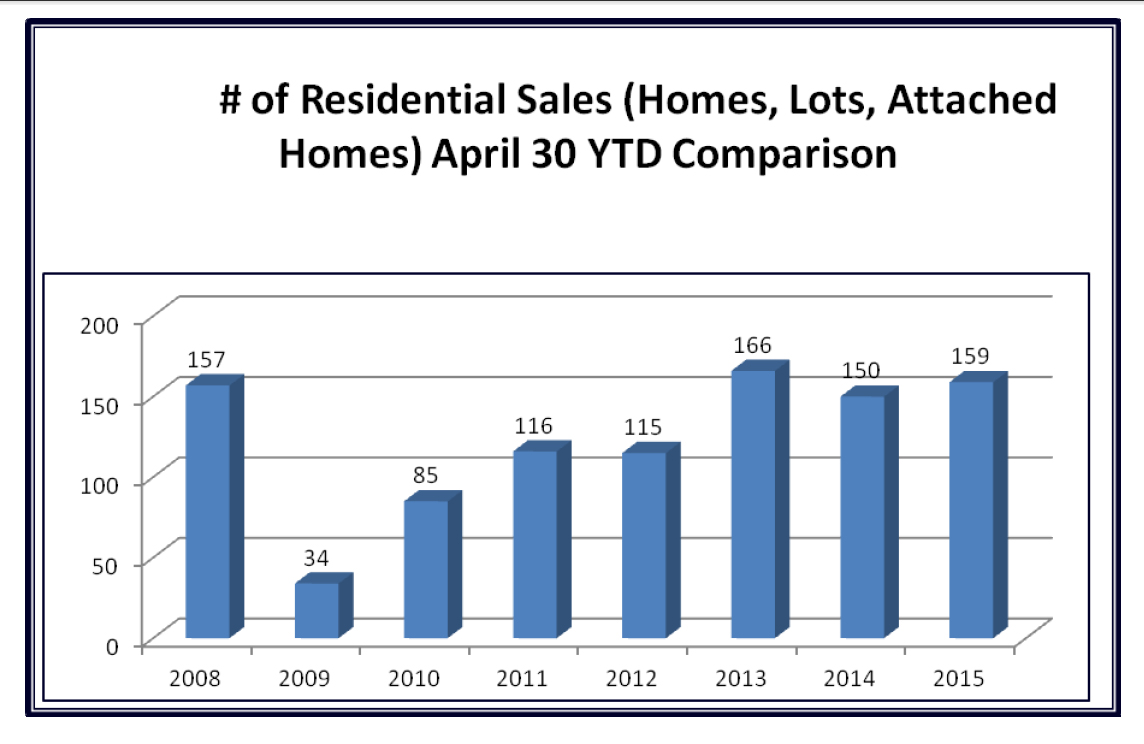
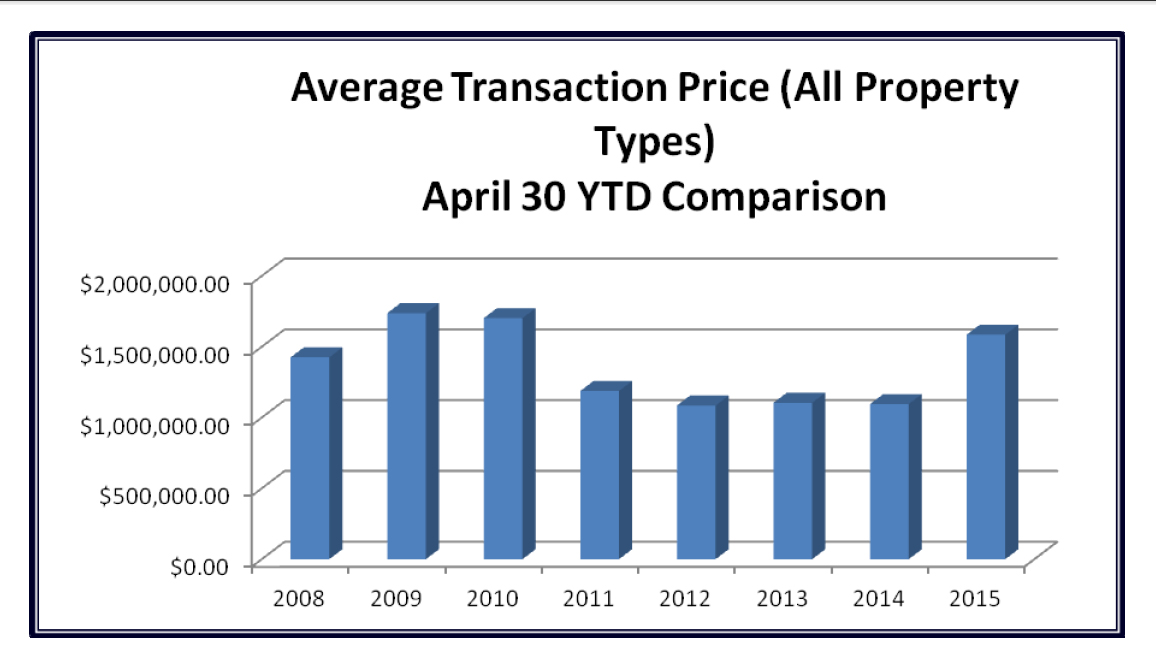
The first four months of 2015 is on track to have an approximate 6% increase in sales volume as measured by the number of sales when compared to data from the previous year. When measuring sales velocity by dollar volume of sales, an increase of 36% is noted, with over $223M worth of real estate being sold in Teton County as of the end of April. The increase in sales volume is mostly attributed to the higher-end Resort Market, as a decrease in available inventory of homes for sale is hypothesized to be the reason for mildly contracting sales numbers for the Local Market. When comparing the sale and resale of the same or similar properties, monthly appreciation rates ranging from .58% to in excess of 2% per month have been noted over the period of 2013-2015 in both higher and more moderately-priced market segments. Of particular interest is the fact that appreciation rates observed using the comparisons of sale / re-sale pairs occurring from 2014 – 2015 have rates of appreciation that are similar to that observed during the 2013-2015 period (both data sets having a mean appreciation rate of approximately 1.4% per month). The implication being that there are not currently any signs of abatement in the observed upward pricing trend.
Single-Family Home Sales Trends Through April 2015
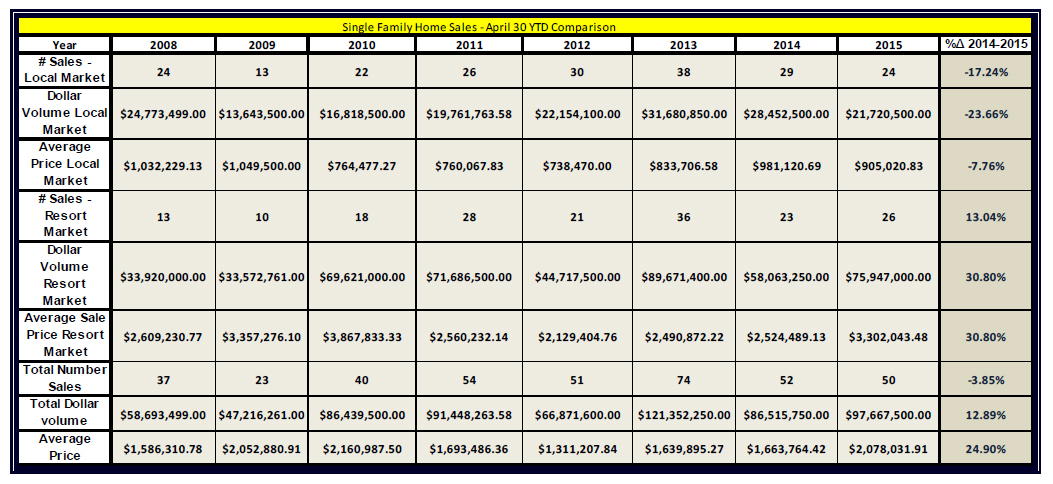
Single-family home sales are down in number by two sales, which is result of a decrease in five sales for the Local Market and an increase in three sales for the Resort Market. Although the Local Market showed a slight decrease in average price, this can be traced to one higher-end sale in 2014 that skewed the average for this year. The average price for the Resort Market increased by 30% from the previous year during early 2015. This increase is partially due to price growth in general, but can also be traced to a surge in higher-end sales for early 2015. More specifically, it was observed that the first four months of 2015 saw eight sales equal or greater than $3,000,000 that had an average sale price of $6,500,000. This represents a nearly 23% increase over the previous year, which saw seven sales greater than or equal to 3,000,000, with the average of these sales being $5,300,000.
Vacant Land Sales Trends Through April 2015
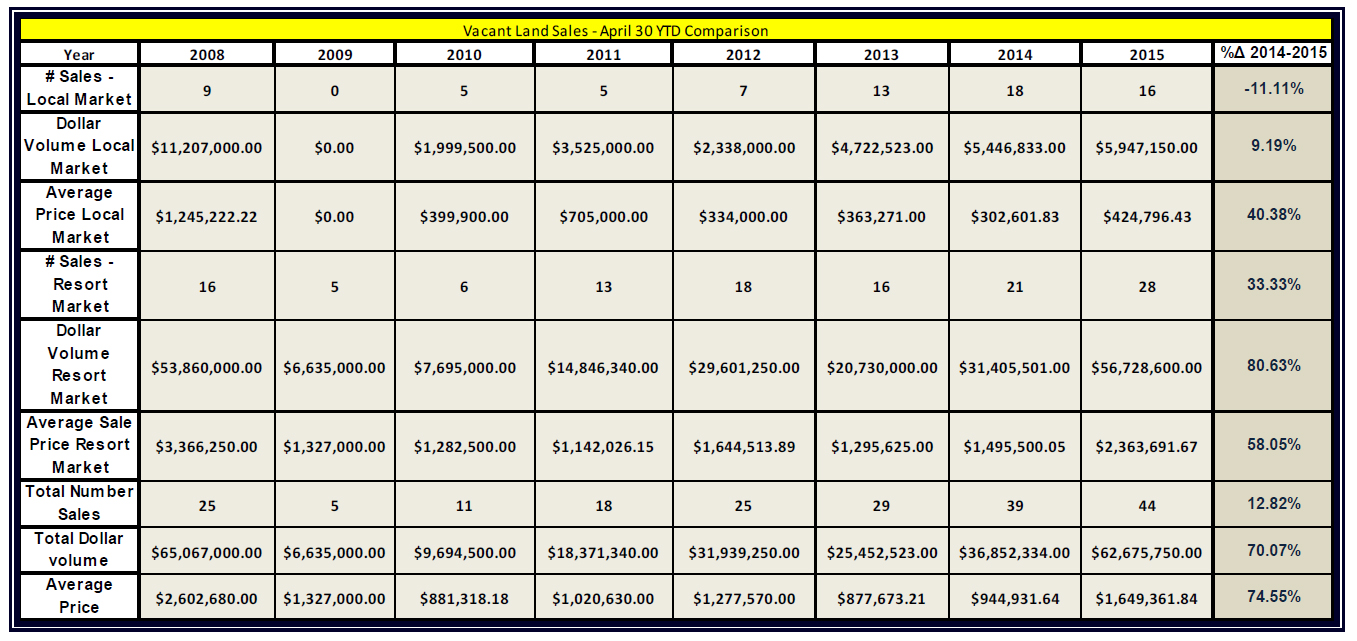
Vacant land sales increased by all measures (number of sales, dollar volume of sales, and average sales price) when comparing data from the end of April 2015 to that of the previous year. The average price of homesites in both the Local and Resort Market segments increase dramatically for this year-to-date. A nearly 60% increase in the average price of the lot sales in the Resort Market is largely attributable to this spring’s total of 17 sales equal to or greater than $1,000,000 (which had an average sale price of $3,050,000). Seven of these sales were from the Shooting Star resort development. By comparison, this same period in 2014 had 14 sales equal to or greater than $1,000,000, with an average price of this grouping being only $2,325,000.
Attached Home Sales Trends Through April 2015
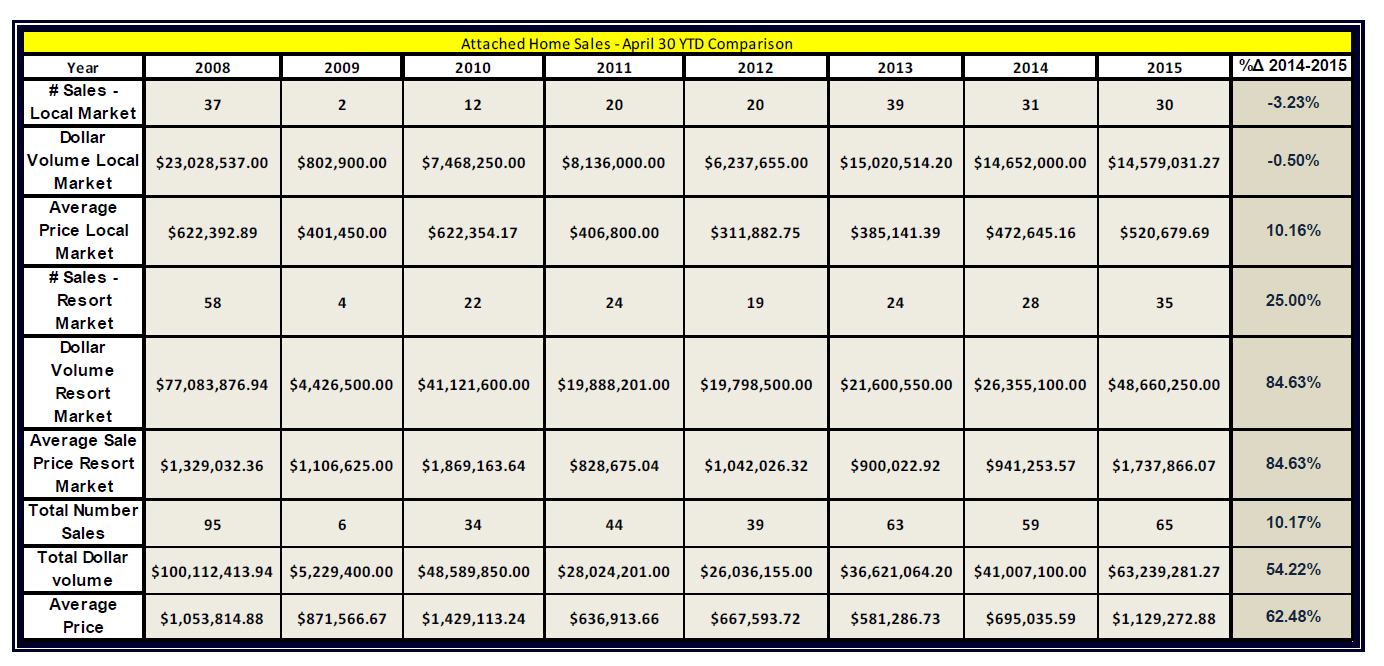
The number of condominium / townhouse sales through the end of April was up in number by approximately 10% from the previous year. Volume numbers were slightly down for the Local Market. However, increasing prices in this market segment stemmed the impact of the slight contraction in sales numbers, and the overall dollar volume of sales remained essentially level for the Local Market. Multiple high-end townhouse /condominium sales in the Teton Village area has caused a nearly 85% increase in the dollar volume of sales for condominium and townhome properties during the first four months of 2015. In 2014, only two attached home sales equal or greater in sale price than $2.0M were recorded by the end of April. This same time period for 2015 has seen eleven such sales, with the average sale price of this grouping being nearly $3.4M.
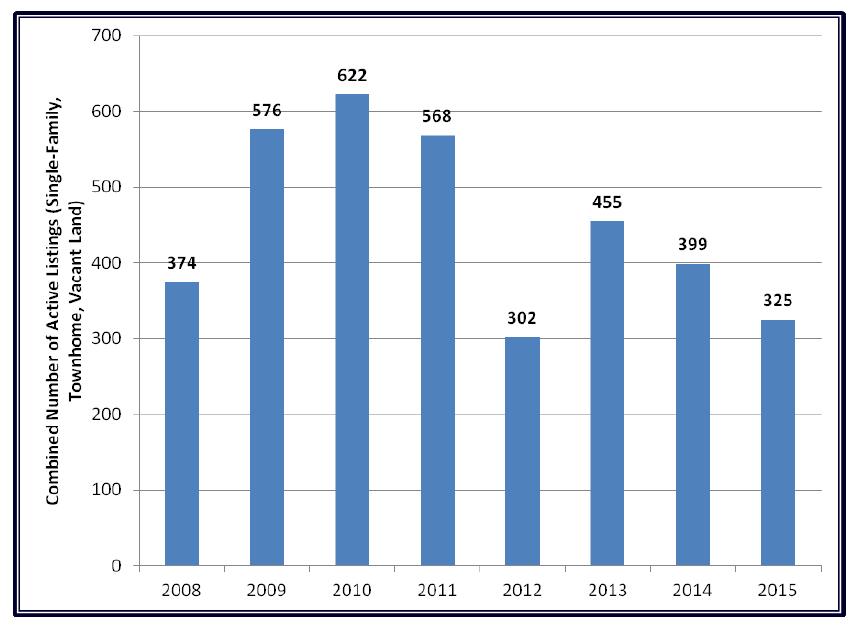
Active inventory
The inventory of homes grew from a shortage of available inventory in 2007 to an oversupply in 2010-11 following the events of the financial crisis. Since 2011, a downward trend has been noted, with inventory being generally opined to be at shortage levels. This trend continued through the first four and one-half months of 2015 with inventory being down approximately 19% overall as of mid-May of 2015 (as compared to the same time in 2014).
Historical Active Inventory Levels as Mid-May
Andrew Cornish – Broker
PO Box 9467 | 155 E. Pearl,
Suite 10
Jackson, WY 83002
(307) 733.8899
(307) 413.7799
Linkedin
![]() Data provided by Rocky Mountain Appraisals, Teton County’s leading valuation firm: www.rmappraisals.com
Data provided by Rocky Mountain Appraisals, Teton County’s leading valuation firm: www.rmappraisals.com