Sales Volume and Prices Increase “Across the Board”
Higher-End Real Estate Leads the Charge
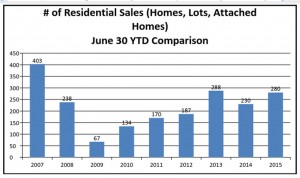
The first half of 2015 is on track to have an over 20% increase in sales volume (number of sales) when compared to data from the previous year. Observing sales data through the end of June, it is noted that the number of sales (homes and building sites in Teton County east of the Teton Range) has increased from 230 in number at this time last year to 280 in 2015. The combination of this trend and an over 43% increase in the average price of the aggregated data created an increase in the dollar volume of sales of 51.69%. While all segments of the Teton County Real Estate Market showed solid growth in pricing and sales numbers, the upper end or “Resort” segment of the market showed the most robust growth. This was largely due to a change in composition of the sales inventory (more luxury properties) as opposed to simple appreciation (although strong appreciation was certainly documented).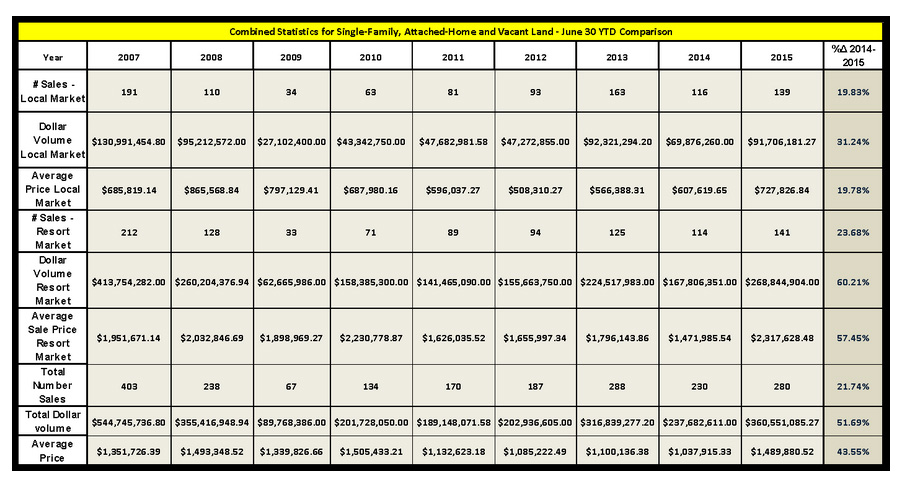
Single-Family Home Sales Trends Through June 2015
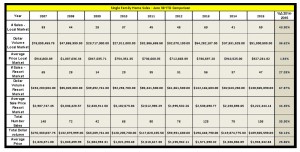 Single-family home sales, after being off as of the first quarter, made up ground and have surpassed the 2014 mid-year volume of 78 sales, with a 2015 reporting of 106 sales. This nearly 36% increase in volume coupled with a 25.86% increase in average price caused dollar volume of sales to surge by 58%. It would appear that pricing of the local market had been relatively flat during the first half of 2015. However, in reality, this was due to the changing composition of sold properties as comparison of sales and resales of the same or similar properties still is providing the indication of high-single-digit and double-digit annual appreciation rates. The higher end market was the driving force behind the growth in aggregated numbers, with high-value properties pulling average pricing up significantly (average pricing in this market segment increased by over 44%). However, in a similar fashion as the aggregated numbers for the local market’s understated appreciation rates, the average price increase for the resort market is an overstatement of price growth due to several luxury property sales skewing the measures of central tendency upward. More specifically, it was noted that 2014 mid-year data for the single-family resort market reported three (3) sales at or above $5M with one (1) of these sales being above $6M. By comparison, mid-year 2015 data for this segment contained ten (10) sales equal to or greater than $5M, with seven (7) of these sales being equal or greater than $6M.
Vacant Land Sales Trends Through June 2015
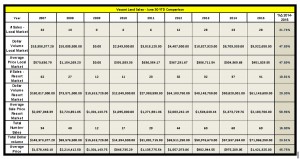 Vacant land sales increased by all measures (number of sales, dollar volume of sales, and average sales price) when comparing mid-year data from 2015 to that of the previous year. Both the Local and Resort market segments showed robust price growth when considering the aggregated data (47.89% and 58.96% respectively). However, similar to the single-family home market, these price increases are the result of the combined effect of increasing values and the changing composition of the sold inventory. Observation of sales and resales of vacant land provide the indication that prices had been increasing since 2012 through 2014 at aggressive rates, with annualized rates being observed in some instance in excess of 20%. Sales and resales of lots that have occurred between 2014 and 2015 are limited, but provide the preliminary indication that appreciation rates may have moderated to the mid-to-high single digits. The luxury segment of the market’s influence on increasing sales trends for 2015 was pronounced, with 2015 year-to-date having three sales equal or greater than $5M adding nearly $20M to the dollar volume of sales (while no such sales having occurred by this time the previous year).
Attached Home Sales Trends Through June 2015
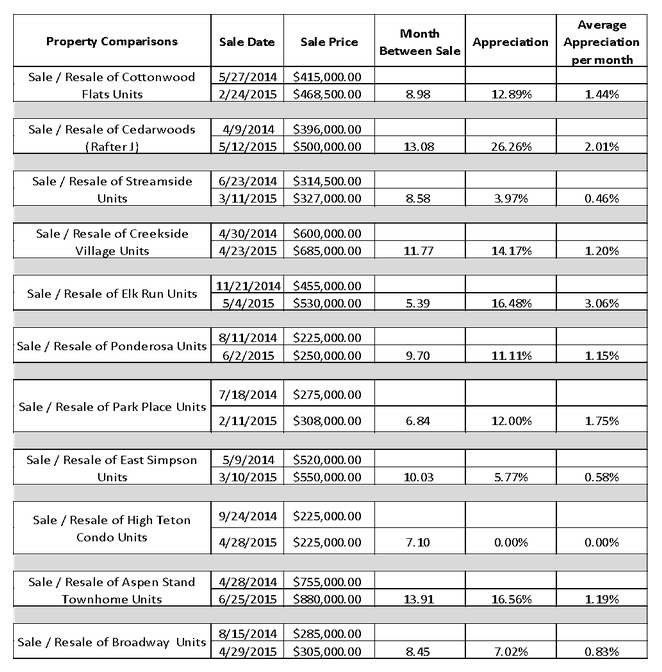
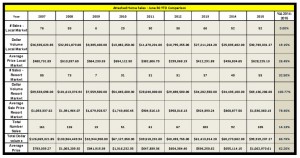 As was the case for both single-family homes, and vacant homesites, the market for attached homes (townhomes and condominiums) was up for all three metrics of number of sales (14.13%), average price (62.26%), and total dollar volume (65.78%). Continuing the similarity with the other segments, the increase in the indicated aggregate price growth was a function of both appreciation and flux in the type of unit being purchased. Appreciation rates for attached homes (as indicated by sales and resales), showed an average appreciation rate of 1.24% (average, not compound) on a sample of 11 comparisons. This figure is down from appreciation rates extracted between the years of 2012 – 2014 (which are opined to have included sales that experienced a rebound “bounce” from recession lows). Even at this robust level of appreciation, it is noted that most of the increase in the average pricing is due to a shift towards more expensive units in the examined period (which could be as much from happenstance as it is a market trend considering the smaller sample size). That said, it was noted that the attached home market saw in 2014 only eight (8) sales greater or equal to $1M, with two (2) of these sales being greater than or equal to $3M. By comparison, the resort attached home market segment in 2015 saw twenty-two (22) sales with a price equal or greater than $1M, with eight (8) sales greater than or equal to $3M.
Noted Appreciation in the Attached Home Market
Andrew Cornish – Broker
PO Box 9467 | 155 E. Pearl,
Suite 10
Jackson, WY 83002
(307) 733.8899
(307) 413.7799
Linkedin
![]() Data provided by Rocky Mountain Appraisals, Teton County’s leading valuation firm: www.rmappraisals.com
Data provided by Rocky Mountain Appraisals, Teton County’s leading valuation firm: www.rmappraisals.com