2015 Sales Volume and Prices Continue to Outpace Previous Year
Drop in Gains From Midyear Reporting is Indicative of a Slower Third Quarter
Subtleties in Appreciation Rates Develop Between Market Segments
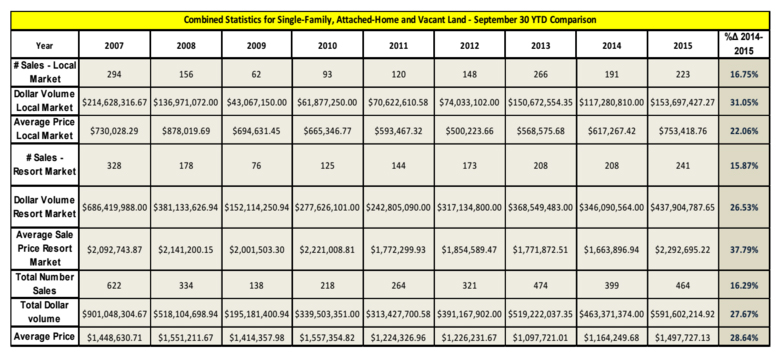
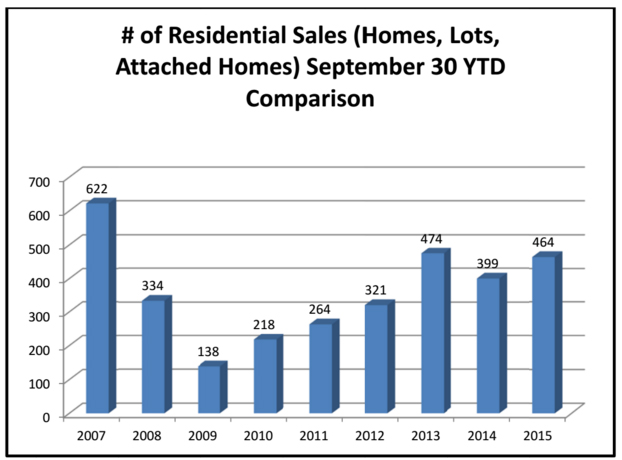
The first three quarters of 2015 reported an over 16% increase in sales volume (number of sales) when compared to data from the previous year. This rate is down from the 20% growth trajectory noted at midyear. However, while the most recent numbers show a contraction in the rate of growth in relative terms, the current year 3rd quarter numbers still showed growth, with 19 more sales occurring through the 3rd Quarter of 2015 as compared to the period ending in the 3rd Quarter of 2014. The combination of the volume growth and an over 28% increase in the average price of the aggregated data created a strong increase in the dollar volume of sales.
While all segments of the Teton County Real Estate Market showed solid growth in pricing and sales numbers, the upper end or “Resort” segment of the market showed the most robust growth in price. This was largely due to a change in composition of the sales inventory (more luxury properties) as opposed to simple appreciation (although strong appreciation was certainly documented). The sales and active listing data of some more moderately-priced developments may be indicative the properties appealing to local wage earners moving towards stabilization (from previously-observed appreciation rates). However, data from resort and second home properties with appeal to those whose income is derived from sources outside the local economy has shown no indication of appreciation moderation to date.
Single-Family Home Sales Trends Through September 2015
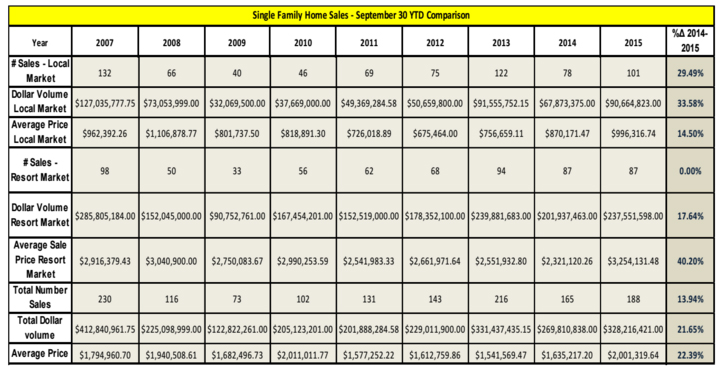
Single-family home sales through the 3rd quarter of 2015 surpassed the 2014 volume of 165 sales, with a 2015 reporting of 188 sales. This nearly 14% increase in volume coupled with a 22.39% increase in average price caused dollar volume of sales to increase by a reported 21.65% (an under reporting due to some unreported sales). Most price growth in the single-family home market was attributable to the Resort Market, which experienced an over 40% growth in average price. This growth in price was largely dependent on a change in composition of the sold inventory rather than pure appreciation. More specifically, 2015 through the 3rd quarter saw 15 sales in excess of $9M, with one sale clearing the $20M mark. By comparison, there were only two single-family home sales in excess of $9M in 2014. This is not to say that appreciation has not been occurring. As continued appreciation for this market segment is supported subsequently in this newsletter through the observation of attached home and vacant land sales and resales.
Vacant Land Sales Trends Through September 2015
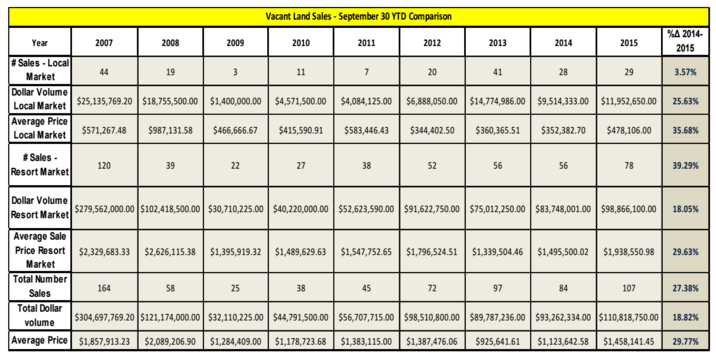 Vacant land sales increased by all measures (number of sales, dollar volume of sales, and average sales price) when comparing 3rd quarter data from 2015 to that of the previous year. Both the Local and Resort market segments showed robust price growth when considering the aggregated data (35.68% and 29.63% respectively). However, similar to the single-family home market, these price increases are the result of the combined effect of increasing values and the changing composition of the sold inventory. The growth in number of sales was strongly influenced by the increased activity in the Shooting Star Golfing Development, which saw 20 sales of these lots that frequent the $2M – $3.5M range. This reporting is significant in comparison to that of 2014, which only saw 7 such lot sales through the 3rd quarter.
Appreciation of Vacant Homesites
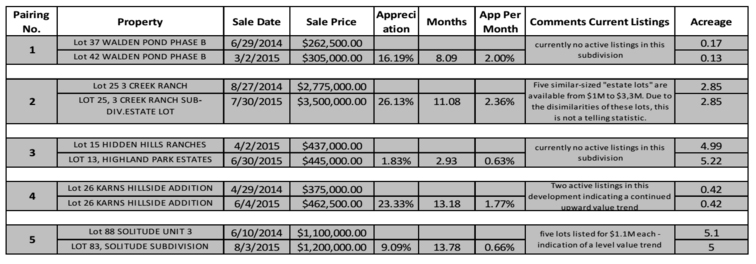
The preceding table arrays five comparisons of identical or similar lots. The top row of each pairing provides a sale that occurred prior to the end of the second quarter of this year, with the lower row of each pairing being a sale that occurred subsequent to this sale date. The result of these comparisons are observed appreciation rates (average – not compound) that range from .63% per month (7.92% annually) to 2.36% per month (28.32% annually). Discrepancies in attributes of the lots in Comparison No.2 are likely to have skewed the indication provided at the higher end of this range, but Comparisons No.1 and No.4 are corroborate the fact that strong appreciation is still evident. An observation of this newsletter in general is that more moderately-priced real estate may be lessening its rate of appreciation as compared to that of higher-end real estate. This trend is not particularly evident for vacant land as evidenced by Comparison No.4 from the Karns Hillside Addition. Contributing factors for the still-apparent bullish trend for vacant land across all market segments include the buyers’ perception of being able to create value through their own design efforts.
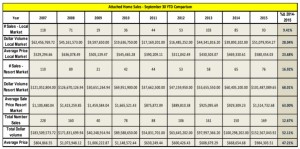 Attached Home Sales Trends Through September 2015

As was the case for both single-family homes, and vacant homesites, the market for attached homes (townhomes and condominiums) was up for all three metrics of number of sales (12.67%), average price (47.21%), and total dollar volume (52.11%). Continuing the similarity with the other segments, the increase in the indicated aggregate price growth was a function of both appreciation and flux in the type of unit being purchased. Appreciation rates for attached homes (as indicated by sales and resales), showed an appreciation rate that may have moderated from that observed earlier in the year (although a small sample size precluded this being a definitive statement). However, even with solid appreciation still being noted, it is observed that most of the increase in the average pricing is due to a shift towards more expensive units in the examined period. As an example, it was noted that the attached home market through the 3rd quarter in 2014 saw only seven (7) sales greater or equal to $2M. By comparison, the resort attached home market segment in 2015 saw twenty-four (24) sales with a price equal or greater than $2M.
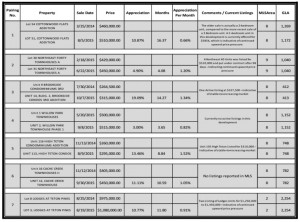 Noted Appreciation in the Attached Home Market

The preceding table arrays seven comparisons of sales and resales which provide indications of monthly appreciation ranging (average- not compound) from a .66% to 1.52%. The average appreciation rate of these comparisons is 1.04%, which is down slightly from a mid-year estimate of 1.24%. Admittedly, the small sample size and the subjectivity in discerning valid comparisons versus anomalies somewhat limits the definitiveness of this observation. That said, the currently-active listings of units at prices only slightly above that of the most recent sales (see comments column for Comparisons No.3 and No.5 as examples) may be indicative of the lower-priced segment of the market moving into a period of more moderate appreciation or stability.
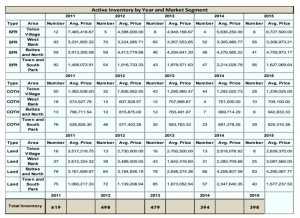 Inventory Level
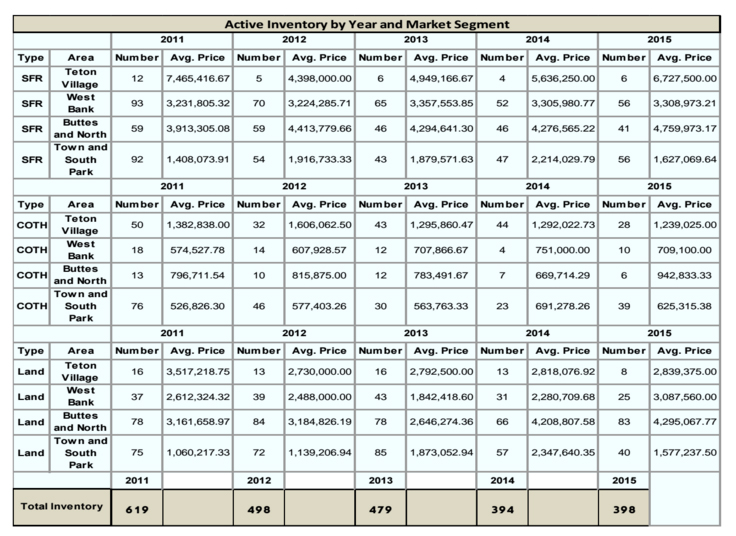
Inventory levels continue to remain low and are frequently cited by agents as a stagnating factor for volume levels. As of November of 2015, the inventory level was essentially flat as when compared to the previous year, with real estate market participants having 398 opportunities in the above-observed market areas as compared to 394 at the same time last year.
Andrew Cornish – Broker
PO Box 9467 | 155 E. Pearl,
Suite 10
Jackson, WY 83002
(307) 733.8899
(307) 413.7799
Linkedin
![]() Data provided by Rocky Mountain Appraisals, Teton County’s leading valuation firm: www.rmappraisals.com
Data provided by Rocky Mountain Appraisals, Teton County’s leading valuation firm: www.rmappraisals.com