Understanding construction costs in Jackson Hole is important when designing your home.
Construction of a home is a series of significant decisions, beginning with the selection of a location and property, and progressing to the home’s design and the development of a construction budget. Though home construction can be viewed as as a daunting process, for most homeowners it is an exciting opportunity to personally define their ideal living environment. That said, one meeting that is best to avoid is what some builders and architects commonly refer to as the “cost crisis” meeting. Such a meeting typically involves the architect, contractor and subcontractors feverishly working to balance the client’s vision of their home with the reality of construction costs and building in the intermountain west. This article is intended to provide those considering land acquisition and home construction with a cost overview that will assist in fulfilling construction of your dream home in the mountains, and doing so without unwanted surprises. Before examining the specific components of construction costs in Jackson Hole, it is important to first gain an understanding of the general market dynamics at work in the Teton County home construction market.
Market Dynamics Contributing to Cost in Jackson Hole
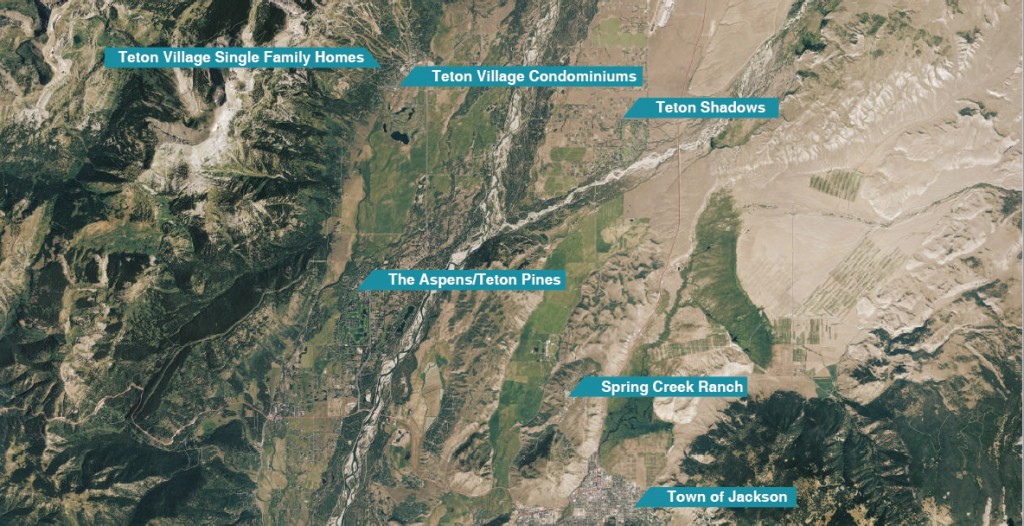
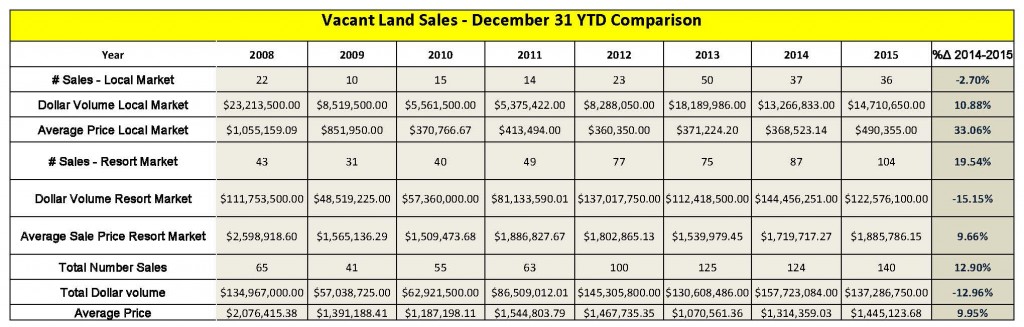
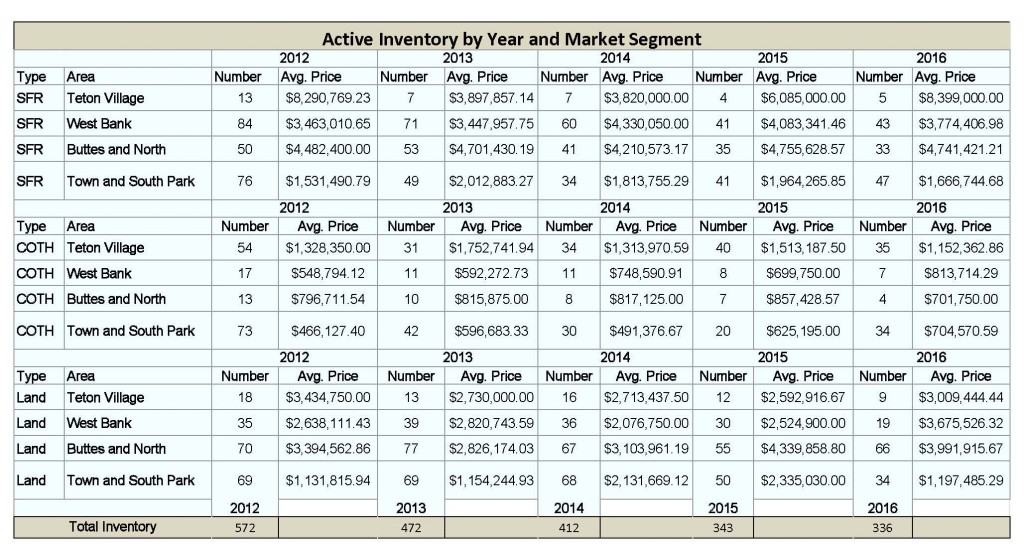
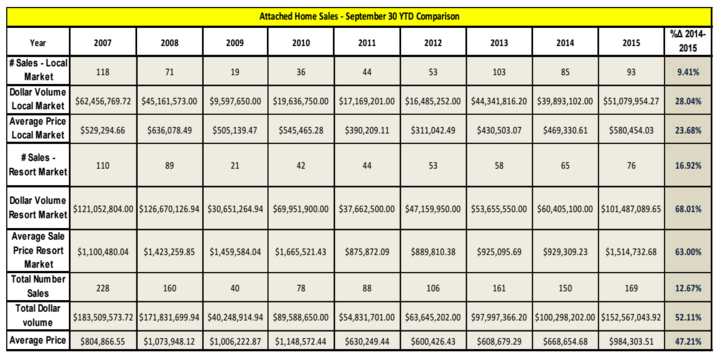
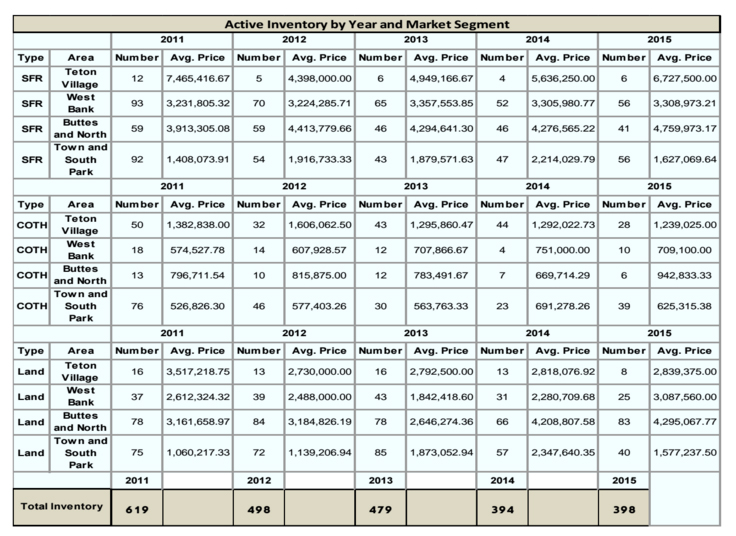
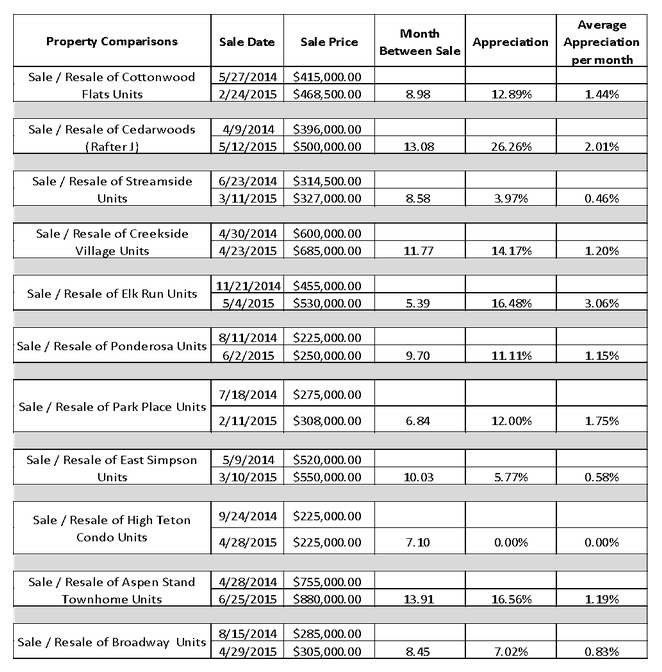
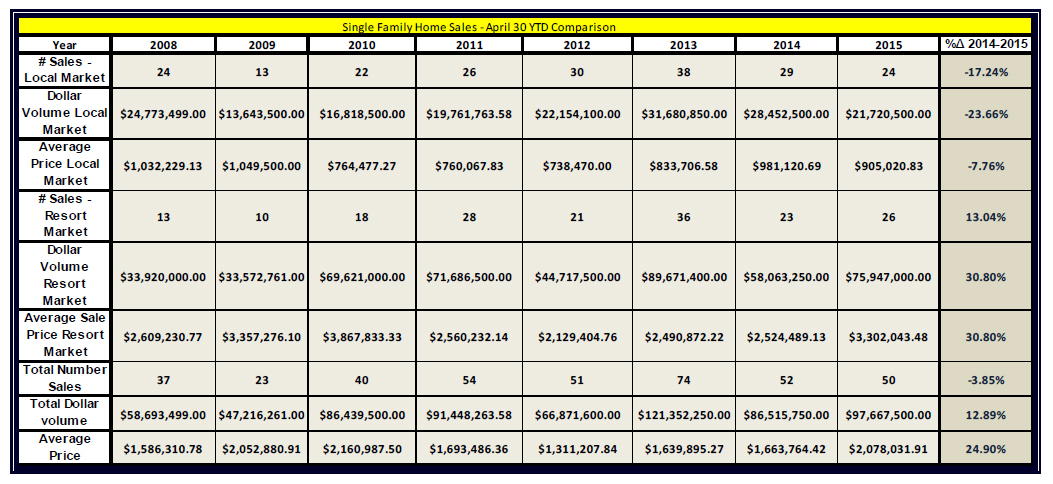
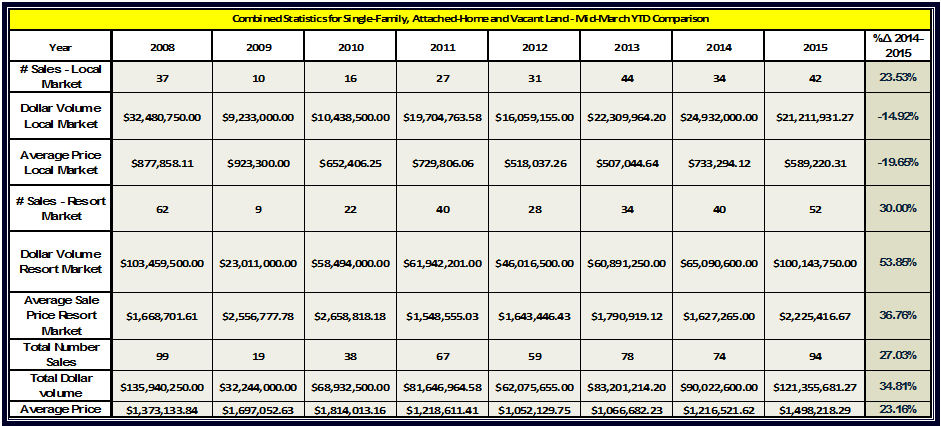
Balancing Quality with Underlying Land Values – In 2015, the average price of single-family homesites of one acre or less in the town of Jackson (See p.24)and South of Jackson (See p.25), where some of the community’s more affordable real estate is located, was approximately $437,000. Common sense dictates that new home builders will need to balance their land investment with quality construction that will be attractive to a future buyer of the property. As such, higher-end home finishes often are used in Jackson’s most price-conscious neighborhoods. In the high-end market, the costs added by high-quality finishes are compounded by the increased price of large-span windows and open areas that are necessary to take advantage of a site’s potentially multi-million dollar price tag.
Environmental Requirements in Home Building– The town of Jackson has an average snowfall of over 70 inches annually and is adjacent to the Teton Range, which is a young mountain range in geologic terms. Homes must be built to withstand snow loads from 120 – 175 pounds, and must meet the requirements of Seismic zone D-1. Such requirements may include engineered foundations, extra attention to the connection points of horizontal and vertical members, and the use of structural steel. Higher insulation ratings also are considered standard construction practices in an alpine climate.
Design – As architectural fees frequently are based on the hard costs of construction, the above-referenced contributors to cost have an additional impact on the design fee, with the design of a high-end home in Teton County being a professional expertise and skillset that is deserved of appropriate compensation.
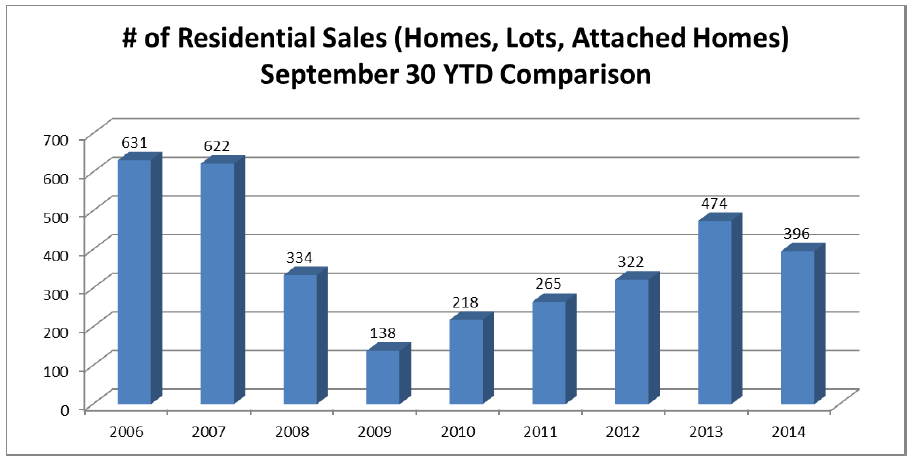
Labor and Material Costs – As compared to major metropolitan areas, in Jackson Hole there is a 10% to 15% premium in cost of materials due to the areas remote location. Additionally, the cost of living and shortage of workforce housing in Teton County contributes to a similar 10% – 15% premium in wages for construction workers as compared to areas with a more fluid and available labor force. An additional problem simply is a lack of subcontractors, where employees of key trades were lost during the construction recession of 2008-2012. At times, a job can be delayed simply because a subcontractor is not available.
Where Fundamentals Meet the Cost Estimate…
Cost Tier 3 Homes
The culmination of this article is an accounting of the cost per square foot (of enclosed area inclusive of garage) to build a Jackson Hole home. Below is an accounting of the costs associated with a home that is located in what we are referring to Cost Tier 3. This tier is the central classification of cost in a five-tier ranking that was created for this article, with the tiers on either side of this cost level being then discussed separately. A home of Cost Tier 3 quality is most likely to be built on a site with a value between $1,000,000 and $2,000,000 and likely is located in any of several Jackson Hole submarkets in the West Bank (See page 22-23) , North of Town (See page 23), and the South of Town (See page 25) market areas. A typical size of this type of home is between 3,000 and 5,000 square feet of enclosed area, with around 20% of this area being non-habitable space, such as garage or storage. For example, a home with an enclosed area of 4,390 square feet may have approximately 890 square feet of this area being non-habitable space. The cost of the home has been allocated into nine groupings or “cost divisions” that we believe are intuitive. However, for a more detailed explanation of these cost divisions visit the resjh.com/016.
Soft Costs – Use of a supervisory architect from start to finish is assumed, with such costs often equating to 10%-15% of the construction budget. Engineering costs are often handled or directly supervised by the architecture firm. The mechanical systems of a home of this size will likely require engineering for property integration in the design process. A home in Teton County of this size will have to pay permitting fees for grading/erosion control, planning and building review, energy mitigation and affordable housing.
General Structure – Poured concrete foundations are typical with framing having to be designed to snow load and seismic zone specs. Increased size of open space spans and open-to-below areas may require the use of steel reinforcement. The anticipated size and complexity of a project of this quality require building through a winter construction season, which adds to cost. Additional contributors to cost include exposed structural systems for visual interest, larger spans for bigger windows, overhangs and multiple covered porches. For a home of this quality approximately 40% to 50% of the construction budget can be attributable to the general structure of the home.
Systems – In a Tier 3 home, HVAC systems can be forced air with multiple zone controls, and some ancillary hydronic in main spaces with hard/tiled surfaces. Possibly some humidification, air conditioning air filtering will exist. Basic control system for lighting and some basic built-in audio visual is typical. Expenditures for systems can be targeted for up to 5% of the overall budget, with this equating to a cost per square foot of enclosed area in the low-to-mid-twenties for our hypothesized Tier 3 home.
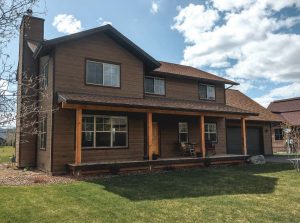
Cladding and Exterior Finishes – Lapped siding is a mainstay of this quality home. However the use of some rock façade extending above snowline becomes more prevalent, as do the incorporation of other material such as oxidized metals and timber accents. Architectural accents such as multi-tiered fascia details can be one of the amenities of homes in this tier. Custom metal siding/roofing are likely to be upgrades that are indicative of cost migrating toward a higher cost tier. An approximation of $125,000 for our hypothesized Tier 3 home calculates to a cost of just under $30 per square foot of enclosed area.
Fenestration – Windows at this leve of home will be of very good quality including aluminum clad wood. Such windows will have multi-point hardware and very good insulation qualities. Brands that have lines covering this range in quality include JELD-WEN, Marvin, Loewen in both stock and custom sizes.
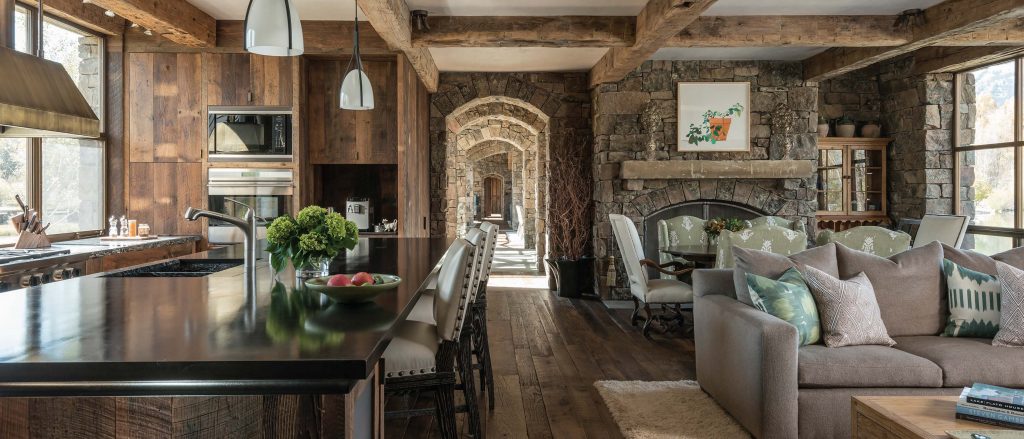
Interior Finishes – In a Tier 3 home, interior walls are of drywall, with the budget often allowing for some accents such as wainscoting or skip troweling for a plaster appearance. Counters are typically of solid stone with metal surfaces being a popular accent. Hardwood floors are a standard for most living areas, with the exception of baths which often employ stone or other natural material tiles. Custom cabinetry and trim of matching or complimentary hardwood is expected. Door hardware from such providers as Emtek, Schlage are noted with fixtures from Kohler, and Moen being frequent choices. As would be expected, interior finish is the second largest contributor to cost after the basic structure of the property.
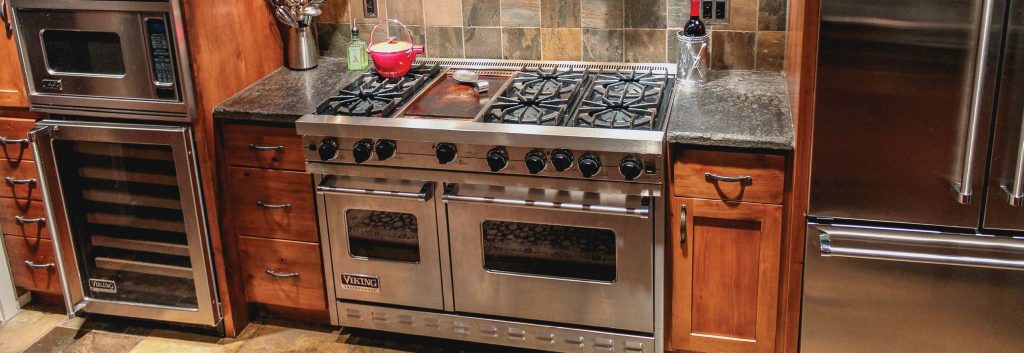
Appliances – Appliances at this price point combine form and function, with selection of kitchen appliances including Thermador, Viking and Wolf, Bosch and Asko. Notably, selections at the higher-end of the cost range are similar to that of many of the finest homes in the value and can be considered an upgrade for this tier of home. As an example, a kitchen appliance package from Subzero/Wolf can be as much as $35,000 more than a package from Kenmore/Whirlpool, which translates to a difference of nearly $8.00 per square foot of enclosed are at this hypothesized home size.
Amenities – Amenities such as gas fireplaces or wood stoves, more extensive decking and additional fixtures in baths are anticipated in a home of this quality. As such features are more a function of owner preference than a recipe for what is expected in a higher-end home, a definitive list is difficult to produce. However, as examples, an “off of the shelf Spa/Hot Tub, a few motorized shades and a simple A/V system can add $50,000 to the cost of a home.
Landscaping Access – The larger size lots associated with this type of home likely necessitate a longer driveway, which adds to cost. Landscaping not only speaks to aesthetics, but also the provision of privacy. Decorative plantings are expected, and a water feature is a possibility that would be more common in a higher cost tier, but not out of the question in Tier 3. Outdoor spaces such as terraces are considered as well.
Mathematically, the above-discussed Cost Tier 3 home equates to a cost of approximately $517 per square foot of enclosed area (see table). However, this is not an absolute; a majority of homes in any particular value tier have several components that would be thought to be more prevalent in other value tiers. In consideration of this, it is realistic to provide a cost range of a Tier 3 home that is between $400 and $550 per square foot of habitable space.
Comparison of Cost Tiers
The following pages address the migration of cost and quality through the categorization of two cost categories of lesser cost (Cost Tiers 1 and 2) and two categories of greater cost (Cost Tiers 4 and 5). As with the detailed analysis of Cost Tier 3, the cost per square foot returned by these compilations are not intended to be absolutes, but rather cost data points within the range of the particular cost tier.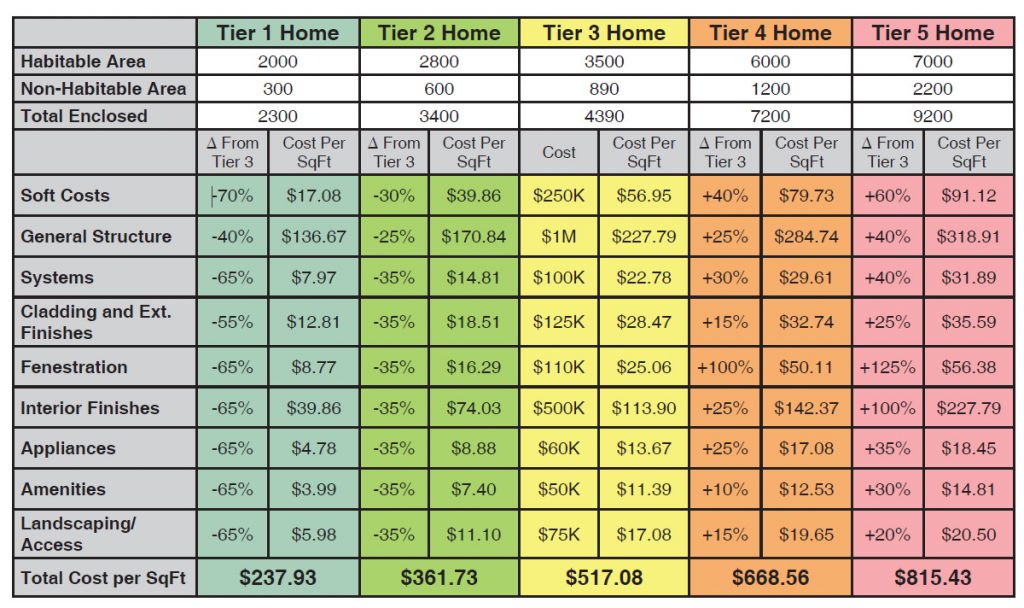
Cost Tier 1
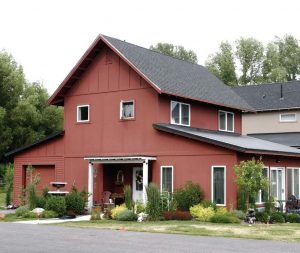
Cost Tier 1 is the most cost-conscious categorization. While “do-it-yourselfers” may be able to edge this cost, it is a pretty lean costing for those who don’t intend to pick up the hammer or supervise subcontractors themselves. Construction costs and finishes in this category are found on Teton County’s least expensive homes. Oftentimes, a homeowner will consider certain features or finishes as “placeholders” to be upgraded in the future. The costing provided by this example illustrates a cost per square foot of $237.93 for Cost Tier 1 homes (see below table). A range of $200 – $250 can reasonably expected for this cost tier.
Soft Costs – • Prospective home builders may shop for generic plans to either use directly or modify. • Self-design of a home is possible for more simple layouts. • Smaller homes will typically have less liability for government exactions.
General Structure – • Engeneering is needed to meet snow loads and seismic zoning. • Simpler architectural lines lend themselves to less expensive layout for concrete and framing. • Use of premanufactured trusses. • Conventional framing and window sizes.
Systems – • Electric baseboard or wall-mounted forced air units. • Light systems for function with some reliance on plug in lighting.
Cladding and Exterior Finishes – • Basic function and affordability are the driving factors for selection. • Wood or fiberboard siding is most typical. • Asphalt shingles are the primary roofing material.
Fenestration – • Vinyl clad window with sliding operation are the best cost option. • Windows in this category are offered by companies such as JELD-WEN and Pella.
Interior Finishes – • Cost efficiency for Tier 1 homes dictates that basic drywall, carpet and vinyl flooring are expected. • Cabinetry and hardware can be purchased effectively from big box home stores.
Appliances – • Entry level appliances from companies such as Roper and Frigidaire lines provide the basic function needed for an entry level house.
Amenities – • By definition, amenities are not the focus of entry level housing. However, frugality in other areas of construction may lead to the ability to have such things as a less expensive gas fireplace as an additional heat source.
Landscaping Access – • Smaller lots may allow for savings on driveway construction. • Gravel drives may be an option in more rural locations. • Landscaping limited to satisfying Town or CCR-based requirements and providing a mud-free access to the front door.
Cost Tier 2
Cost Tier 2 is considered to be a good or very good quality home by many national costing services. Homes of this quality often will be built on site having a value between $350,000 – $750,000. A detailed description of this type of home can be found on the Cornish | Lamppa websites at resjh.com/016. However, in general, a Cost Tier 2 home will employ an architect for core/shell level of plans and smaller spans supported by beams or columns. The home will have a central heat system and appliances by brands such as Kenmore and Whirlpool. Countertops may be tiled, and some pre-finished wood flooring is installed. A Cost Tier 2 home shows a cost per square foot of $361.73 in our example. A range of $250-$375 can reasonably expected for this cost tier.
Cost Tier 4
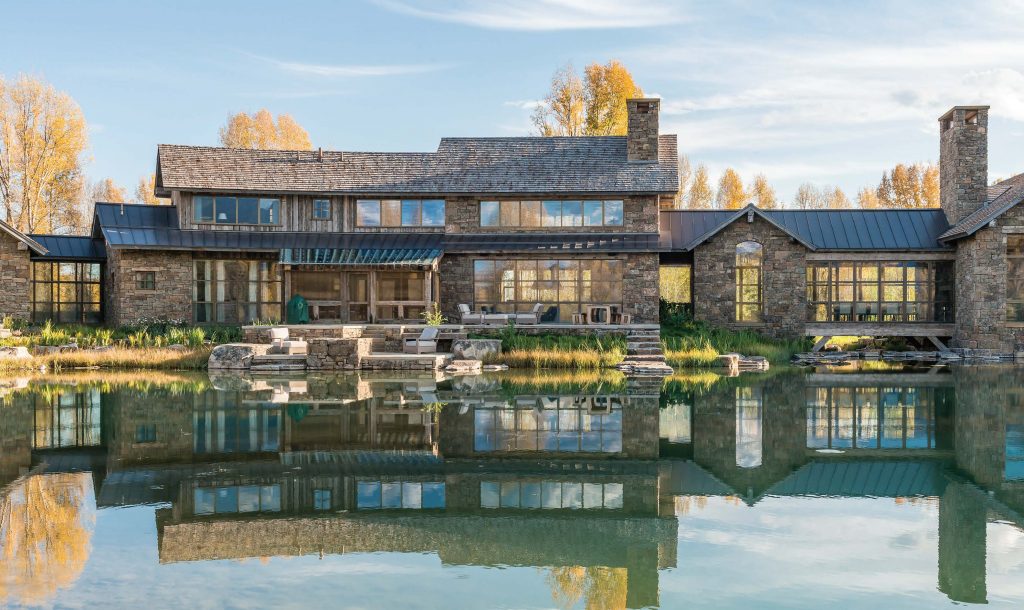
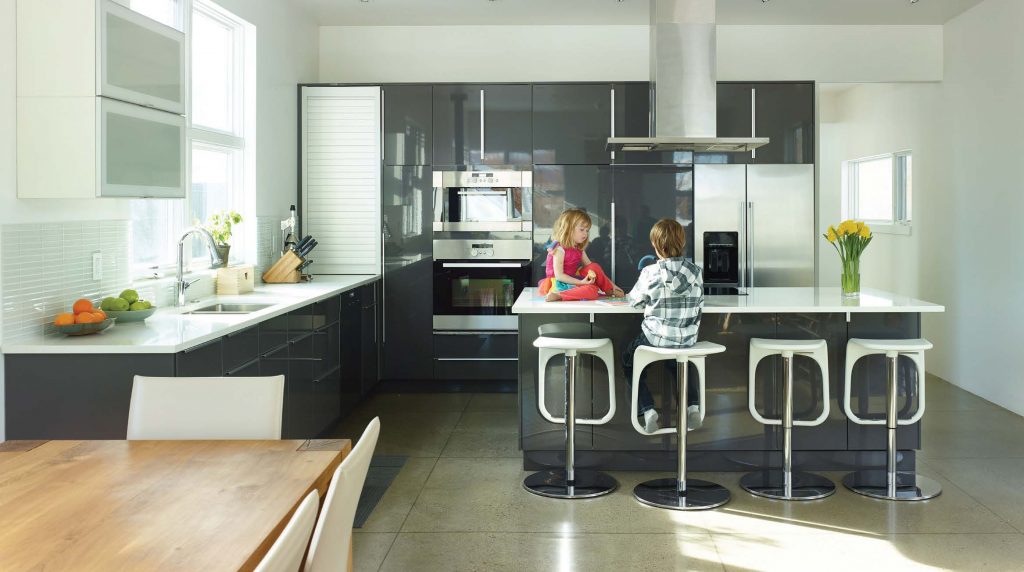
Cost Tier 4 is what most people familiar with high-end resort real estate consider an excellent or luxury quality home. In general, homes of this nature are built on sites with values greater than $2,000,000, and quite frequently greater than $4,000,000. Homes in this price category arguably are some of the finest in the valley, with cost increases for Cost Tier 5 often only being a function of owner preference. (Arguably, some of the expenditures in Cost Tier 4 may be similarly motivated.) The costing provided by this example shows a cost per square foot of $668.56 for a Cost Tier 4 home. A range of $550 – $750 can reasonably expected for this cost tier.
Soft Costs – • Full architectural services from design oriented firm, fully custom design • All engineering, civil, structural, mechanical, plumbing, electrical, lighting design, A/V design • Teton County – affordable housing fees can become significant depending on size of house.
General Structure – • Larger spans to accommodate views and cantilevered spaces – often necessitating the use of red steel. • A project of this size will run through one winter building season.• Architectural designed and engineered trusses/exposed structural systems • Larger roof overhangs • Decks over heated spaces below or upper level waterproof decks.
Systems – • Top-of-the-line HVAC system and hydronic heat – humidification and air conditioning • All systems inclusive of A/V and lighting are integrated into advanced control system • Visually hidden systems such as air purification using discrete linear diffusers or hidden altogether • Geothermal heat pumps, photovoltaic panels • Back-up generators.
Cladding and Exterior Finishes – • Custom wood and metal siding • Stone Veneer – unique, but less complex in application • Installation of stone from a quarry supply • Heavy, hand-split cedar shakes.
Fenestration – • Custom designed aluminum clad wood windows with custom colors and finishes • Packages may include large lift/slide doors • Brands may include Albertini, Unilux, Dynamic, Grabill • It is not out of the question for a Tier 4 window package to be nearly four times of that of a standard window package.
Interior Finishes – • Drywall – Level 5 finish or Plaster • High end tile/countertops from Ann Sacks, Waterworks, Interior Stone veneer or custom wood veneers. • Custom Cabinetry throughout • Hardware from Sun Valley Bronze, Rocky Mountain, FSB • Fixtures – Waterworks, Kalista. Multiple bathrooms with 4 or more fixtures (two sinks or tub and shower).
Appliances – • Top-of-the-line Sub-Zero and Wolf throughout • Appliances may have unique features such as dishwasher drawers, under cabinet refrigerators outside of kitchen area • Multiple washers/dryers wine refrigerators.
Amenities – • Custom gas fireplaces, double-sided wood fireplaces • Custom spas • Steam showers • Extensive A/V system, security system.
Landscaping Access – • Longer driveways • Water features, radiant stone terraces • Exterior A/V system • Exterior lighting, some being decorative • Enclosed porches.
Cost Tier 5
Cost Tier 5 is similar to the finish and form of a Cost Tier 4 home in many ways, but it is an end product that speaks to a collaborative effort between a property owner and a design team to place the distinct stamp of the owner on a property. This cost tier not only represents complexity of design and execution of construction taken to its highest level, but also includes undertakings such as the purchase and integration of antique structures into a home or the milling of structural timbers on site. The cost of a Cost Tier 5 home is approximately $815 per square foot in our example. However, the cost of this type a home is only limited by the imagination of the owner, and cost calculations from $750 to over $1,500 per square have been noted in Teton County. A detailed description of this type of home can be found on the Cornish | Lamppa website at resjh.com/016.