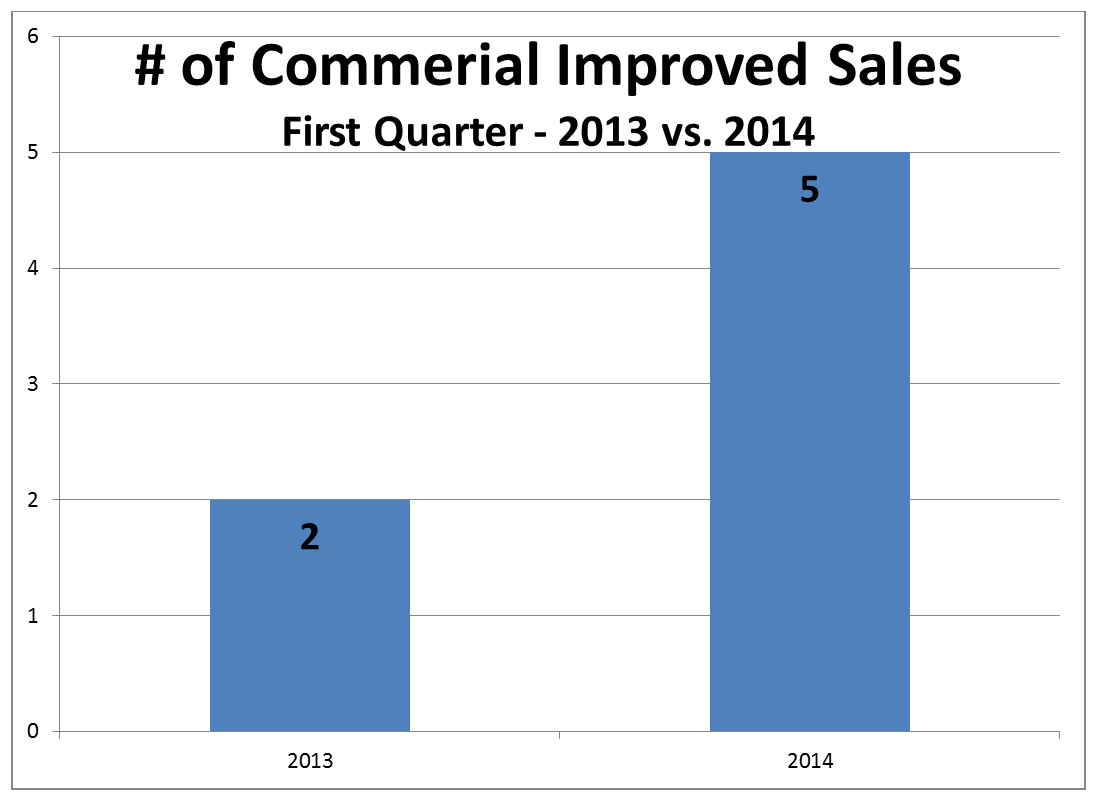
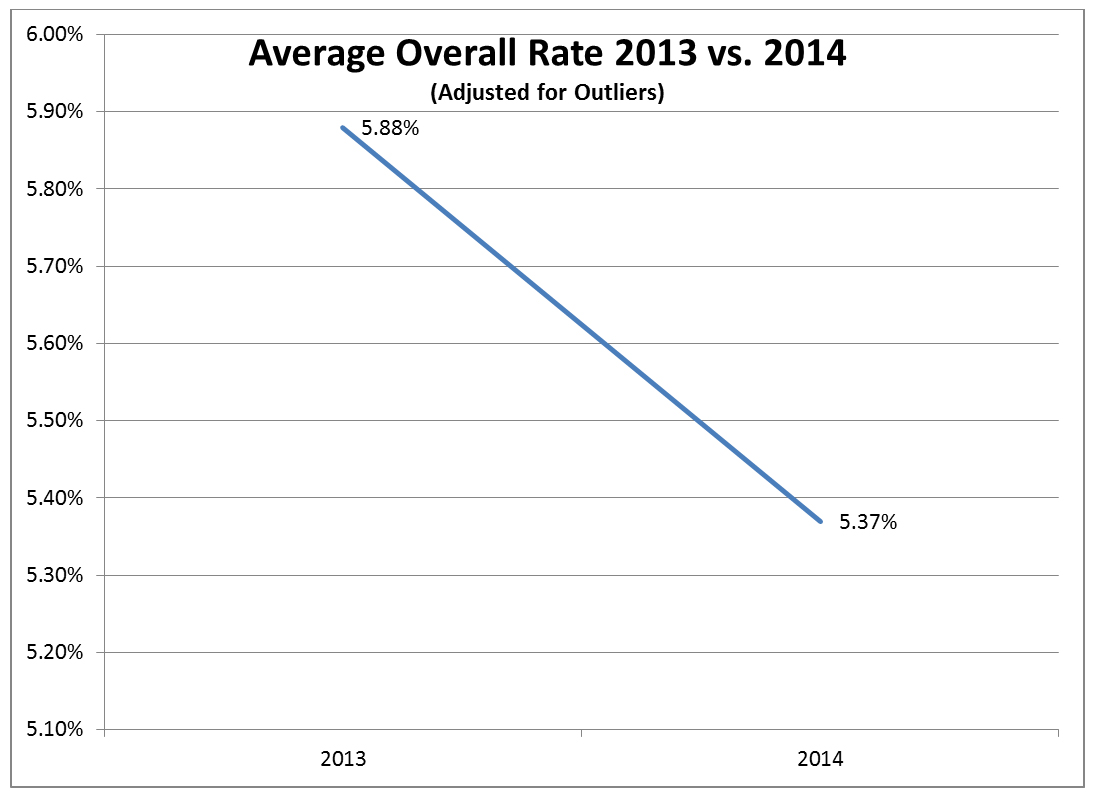
Blog

Strong Price Points in Rafter J Ranch

Bodes Well for One of Teton County’s Most Populous Residential Areas

A 2,200 square foot home sold in Rafter J Ranch at the end of March for approximately $345 per square foot. This is noteworthy as it is evidence of the continued price growth of living opportunities in one of Jackson Hole’s largest mid-priced subdivisions (and one which is often considered a barometer for all more moderately priced homes in Teton County).  This property is located in the newer, western portion of the development, which has historically contained some of the stronger price points in Rafter J.  Comparing home sales from this area in recent history, it is noted that this latest price continues an upward price trend that started in 2011 and places this metric at approximately 94% of the 2007 – 2008 average.

average-price-rafter-j

jhresearch_logoAndrew Cornish | Broker
PO Box 9467 | 155 E. Pearl Avenue, Suite 10
Jackson, WY 83002
(307) 733.8899 | (307) 413.7799 cell
Linkedin

Access to the most comprehensive sales database anywhere
from the leading brokerage and appraisal business in Teton County.

rma-logoAndrew Cornish MAI, SRA
www.rmappraisals.com

Real Estate Prices Increase Through January

Price Gains are Evident Through First Month of 2014
Less Inventory Contributing to Slightly Lower Sales Volume

Residential – Observing data compiled through the end of January of 2014, it is noted that the number of residential real estate sales (single-family homes, attached homes, and vacant lots) are down slightly from 32 total sales during the first month of last year to 26 sales during the same period of this year. A lack of inventory is the most obvious culprit to the decrease in sales volume. While the sales volume as measured by number of sales decreased over 18%, an over 19% increase in average sales price mitigated much of the loss in dollar volume of sales, with this measure only showing an approximately 3% decline.  Observation of active listings in mid-march showed that the available inventory was down approximately 18% from March of last year, with 370 active listings being available currently, as compared to 451 listings being active at this time last year.

 (click on tables/charts to see enlarged view)

average-price-jan-ytd-comparison

jhresearch_logoAndrew Cornish | Broker
PO Box 9467 | 155 E. Pearl Avenue, Suite 10
Jackson, WY 83002
(307) 733.8899 | (307) 413.7799 cell
Linkedin

Access to the most comprehensive sales database anywhere
from the leading brokerage and appraisal business in Teton County.

rma-logoAndrew Cornish MAI, SRA
www.rmappraisals.com

Trends in Teton Pines Cluster Home Prices

Offering Insight Into West-Bank Single-Family Home Value Patterns

The Teton County market began its price recovery in mid-2011, with this market inflection being most easily observed in more moderately-priced market segments where sales volume was most likely to be ample enough to have trends be more easily observed. This is especially true for single-family homes where differing levels of finish, condition differences, and fluctuations in underlying site value greatly reduce the meaningfulness of metrics such as price per square foot.

The Teton Pines Cluster Homes offer one valuable exception to this rule, in that these upper-end living opportunities are relatively similar in exterior design and are located on identically-sized lots. Granted, differences in view, interior finish, and golf proximity do cause variations in price point between such homes. However, these differences aside, the observation of price growth from 2003 – 2008 in these units; their subsequent price correction through mid-2011; and their most recently-observed price gains offer corroboration for the hypothesis that West Bank single-family home prices are trending in a manner similar to that of many Teton County properties.

Andrew Cornish

teton-pines-cluster-home

jhresearch_logoAndrew Cornish | Broker
PO Box 9467 | 1315 S. Hwy 89, Suite 201 Jackson, WY 83002
(307) 733.8899 | (307) 413.7799 cell
Linkedin

Access to the most comprehensive sales database anywhere
from the leading brokerage and appraisal business in Teton County.

Condo-Tel Units Showing Increasing Values

Condominiums have long been a way to provide Teton County market participant an opportunity to own their piece of Jackson Hole without the maintenance responsibilities of a detached, single-family home.

In 2001, this concept was expanded for Teton Village market participants when the Snake River Lodge and Spa introduced its units known as the “Residences.”  The owners of these units benefited from the receipt of a portion of room revenues generated through the front desk, as well as the hope of gains through appreciation.

Condominium hotel units (condo-tels) increased in popularity over the next several years, with projects such as Teton Mountain Lodge and Hotel Terra being developed to meet the consumer demand.  Using Teton Mountain Lodge and Hotel Terra as a gauge of this market, the value of these types of units were noted to increase steadily through 2007. However, the mortgage credit crisis of mid-summer 2007 took its toll on these units, with financing becoming challenging and purchaser concerns over rental revenue playing a large part in a decline that was noted to extend through 2012.

2013 brought the welcome reversal of this trend, with the average price of Teton Mountain Lodge and Hotel Terra Units increasing over 30% during this period.  A reported on-going strengthening of revenue per room in these units bodes well for the continued recovery of Teton Village condo-tel units.  If you have an interest in Teton Village condo-hotel property, or any property in Teton County, don’t hesitate to contact the Cornish | Lamppa Realty Group today.

Andrew Cornish

condo_telo_graph

jhresearch_logoAndrew Cornish | Broker
PO Box 9467 | 1315 S. Hwy 89, Suite 201
Jackson, WY 83002
(307) 733.8899 | (307) 413.7799 cell
Linkedin

Access to the most comprehensive sales database anywhere
from the leading brokerage and appraisal business in Teton County.

Agents turning to unlisted lots to fill demand for premium building sites in Jackson Hole

land-for-sale-tetonsI was initially given pause last year during the course of a casual conversation when it was remarked that, “you can’t really find a decent lot in Teton County for less than $5,000,000.” My surprise at this comment was somewhat lessened when the definition of a “decent lot” was further classified as being three acres or larger, within 15-20 minutes of Teton Village and uniformly comprised newer high-end construction.

Learning that my acquaintance’s definition of “high-end construction” referred to homes of the finest quality in the valley, my surprise lessened again, but did not disappear, as I was aware of lots fitting this bill having sold for less than $2,500,000 the previous year.

However, when I later reviewed the available inventory of lots fitting this somewhat refined criteria, I was surprised to find that there was truth to the claim that there were not homesites available for less than a rounded $5,000,000 when setting your sites on luxury homesites large enough to keep very large homes situated in a secluded fashion. Once more, it was interesting to note that the lot I had been using as my yardstick for value was, at that time, listed for over 2.5 times its previous year’s acquisition price. While this hope for a windfall by the lot-flipping entrepreneur was ultimately not successful, the fact remained that better opportunities were not readily available.

This was particularly true for those market participants who did not embrace the eclectic feel of a Jackson Hole neighborhood that may include a historic log cabin (or perhaps not so historic….) as a neighbor. Notably, opportunities for such buyers can often be found, but require the research of an agent willing to locate sellers who have not openly listed their property for sale. In recognition of such changing market dynamics, it is becoming increasingly important for prospective buyers to ally themselves with competent representation to locate and acquire their definition of a Jackson Hole dream location.

Andrew Cornish

jhresearch_logoAndrew Cornish | Broker
PO Box 9467 | 1315 S. Hwy 89, Suite 201 Jackson, WY 83002
(307) 733.8899 | (307) 413.7799 cell
Linkedin

Access to the most comprehensive sales database anywhere
from the leading brokerage and appraisal business in Teton County.

Market Update – Year End Summary 2013

Residential:  Local Market Dominates Sales as Inventory Continues to Decline

Commercial:  Jackson Commercial Property Values Remains Stable,
Developers Enter Market With Speculators

Residential – Observing data compiled through the end of 2013, it is noted that the number of residential real estate sales (single-family homes, attached homes, and vacant lots) are up from 481 total sales during 2012, to 626 sales this year (an increase of over 30%). This rate of increase is slightly greater than the 28.6% increase in number of sales observed when comparing 2012 volume to that of 2011.  Notably, this yearend sale volume is only a rounded 23% less than the volume noted at this time in 2006 (the last year unaffected by the mortgage crisis of 2007).  It could be argued that a low-twenties disparity in current sales volume numbers from that of 2006 is not a measure that is indicative of a recovery.  However, when noting that the 2013 number of sales is 172% above the 2009 low recording of 230 sales, a more positive perspective is gained. It is also believed by many that a lack of inventory, not demand, is the primary limitation to greater sales volume figures.  Further indication of the ongoing recovery is that the dollar volume of sales is up over 17% from the preceding year.  The average price for real estate is down nearly 10%.  However, this was due to an increase of more moderately price inventory being sold throughout the year to date, with the local-oriented market showing a 60% jump in number of sales, while the resort-oriented market only grew by 6.3% in transaction numbers.  The intuition that the declining average sale price is due to the changing composition of the inventory of sold homes (and not value erosion) is further corroborated by the examination of individual property sales / re-sales, which provide the indication that values, on average, have been increasing between .25% and 1% since the market reaching an inflection point in mid-2011. Observation of active listings as of December 2013, shows that the available residential sales inventory is currently 10% less than it was at this time last year and currently only 21% above 2007 levels. While this presents a challenge for those seeking a home, it provides a benefit to the selling side of the equation.

Commercial – The number of commercial sales as of yearend was down slightly, but this drop is not seen as being a significant indicator of commercial activity due to the small sample size. Moreover, commercial capitalization rates remain bullish for Teton County, with office and retail properties most often yielding capitalization rates between 5% and 6%.  A positive for the commercial market is also gleaned from the fact that developers are now competing for vacant land, removing this market from being the exclusive haunt of speculators and land bankers.

 (click on tables/charts to see enlarged view)

Summary of Market Statistics

Combined-Sales-Home-Lots-Yearend-Comparison-Dec31

Average-Transaction-Price-Dec31YTDView the Full Market Report on Rocky Mountain Appraisals
or Download PDF version

brought-to-you-by-RMA

Market Update – Data through Oct 31, 2013

Residential: Gains Continue Over 102 – Inventory at Lowest Point Since 2007
Commercial: Advance Bookings Boost Hope for Good Visitation Season

 Residential – Observing data compiled through the end of October of 2013, it is noted that the number of residential real estate sales (single-family homes, attached homes, and vacant lots) are up from 376 total sales during the first nine months of last year to 541 sales during the same period of this year (an increase of 43.88%). This is considered to be on pace with the 44.58% increase that was noted at the end of September. It should also be noted that the current year-to-date sale volume is only a rounded 23% less than the volume noted at this time in 2006 (the last year unaffected by the mortgage crisis of 2007). It could be argued that a low-twenties disparity in current sales volume numbers from that of 2006 is not a measure that is indicative of a recovery. However, when noting that the 2013 YTD number of sales is 222% above the 2009 low recording of 168 sales, a more positive perspective is gained. Further indication of the ongoing recovery is that the dollar volume of sales is up nearly 29% from the preceding year. The average price for real estate is down nearly 8%. However, this was due to a flurry of more moderately price inventory being sold throughout the year to date, a point that is further corroborated by the fact that examination of individual property sales provides the indication that values, on average, have been increasing between .25% and 1% since the market reaching an inflection point in mid-2011. [1] Furthermore, it is opined that one of governing factors contributing to the recovery of the rate of sales not even being greater than currently exhibited is a declining inventory of available homes for sale. Observation of active listings in mid-December, shows that the available residential sales inventory is currently less than half of what it was last year and currently at its lowest point since 2007. While this presents a challenge for those seeking a home, it provides a benefit to the selling side of the equation.


Commercial – The number of commercial sales as of the end of October was down slightly, with 17 sales occurring in 2013 as compared to 21 in 2012. However, this drop is not seen as being a significant indicator of commercial activity due to the small sample size. Moreover, commercial capitalization rates remain bullish for Teton County, with office and retail properties most often yielding capitalization rates between 5% and 6% and hostelry properties yielding overall rates more typically in the 7%-8% range.  In that vein, local hostelry operators are cautiously optimistic on the upcoming winter season with advance bookings reported to be slightly up in Teton Village, while reportedly remaining level for most in-town properties. The Rocky Mountain Lodging Report provides that revenue per available room (RevPar) for the Jackson market place was up approximately 4.5% as of October year-to-date.


*Value trends vary between market segments and property types.

Summary of Market Statistics

 (click on tables/charts to see enlarged view)

residential-sales-oct-31

average-transaction-price-oct-31


Combined Sales Data – All Property Types

combined-sales-data-property-types

Vacant Homesite Market Segment

vacant-homesite-market-segment

Attached Home (Condominium / Townhouse) Market Segment

attached-home-market-segment

Single Family Market Segment

 single-family-market-segment

active-residential-inventorybrought-to-you-by-RMA

August 2013 YTD Market Update

Gains Widen Over Previous Year For Sales Volume, Substantially Up From 2009 Lows

Observing data compiled through the end of August of 2013, it is noted that the number of residential real estate sales (single-family homes, attached homes and vacant lots) are up from 282 total sales during eight months of last year to 415 sales during the same period of this year (an increase of over 47%). This is an impressive statistic on many levels. Firstly, this growth is sustainably over the gain experienced between 2011 and 2012 (30%), which is indicative of an accelerating recovery. Secondly, this growth is noted to have occurred in the face of declining inventory, which is a mitigating factor to such trends. Finally, the current level of year-to-date sale volume is only a rounded 24% less than the volume noted at this time in 2006 (the last year unaffected by the mortgage crisis of 2007). It could be argued that a mid-twenties disparity in current sales volume numbers from that of 2006 is not a measure that is indicative of a recovery. However, when noting that the 2013 YTD number of sales is 295% above the 2009 low recording of 105 sales, a more positive perspective is gained. Further indication of the ongoing recovery is that the dollar volume of sales is up over 43% from the preceding year. The average price for homesites is up 20%. However, this was due to an anomalistic spike in multi-million dollar lot sales in 2012 that has skewed the aggregated data. This point is further corroborated by the fact examination of individual property sales provides the indication that values, on average, have been increasing at 1% per month since the new year.*

*Value trends vary between market segments and property types.

Summary of Market Statistics

 (click on tables/charts to see enlarged view)

Screen shot 2013-09-27 at 1.29.22 PM

Screen shot 2013-09-27 at 1.30.02 PM

Combined Sales Data – All Property Types 

Screen shot 2013-09-27 at 1.15.09 PM

 Individual Market Segment Performance

Vacant Homesite Market Segment

Screen shot 2013-09-27 at 1.18.46 PM

Attached Home (Condominium / Townhouse) Market Segment

Screen shot 2013-09-27 at 1.22.29 PM

Single Family Market Segment

Screen shot 2013-09-27 at 1.23.06 PM


2013 Mid-Year Market Report

Prices Rebound During First Half of 2013- Sales Volume Up Over Nearly 50%

Observing data for mid-year 2013, an increase in the number of transactions of nearly 50% was noted in comparison to 2012 data from this time period. This gain came in combination with an average price measure that remained essentially level. The result of these indications was an increase in dollar volume of sales of over 40%. Closer observation of the underlying data indicates that appearance of level (or slightly decreasing) values is the result of a marked increase in the number of sales in the more moderately-priced segments of the market (which diluted aggregate numbers giving the appearance of a level price trend). This observation is further corroborated by the comparison of sales and re-sales of similar properties, which show that prices experienced upward pressure during the first half of this year. This price rebound is likely the result of several market forces. However, the predominant forces which are contributory to this trend are hypothesized to be a market fear that favorable financing terms will not exist forever, a pushback to overcorrected price levels. Additionally, it has been noted that available inventory of homes and vacant land has been steadily contracting over the past three years, with active inventory as of the end of May being down 18.32% compared to the same time last year.

Both the Resort and Local market have benefited from the above-described upward pressures. The higher-end Resort Market showed positive trending, with the number of single-family homes with sales prices above $3,000,000 showing the second highest dollar volume of sales since the record year of 2007. However, the most dramatic upward pressure was noted in the more moderately-priced Local Market, where sales volume increased by a margin of over 68% from last year.


link_image

Copyright 2021 Cornish Lamppa Realty Group. All rights reserved.

Wyoming Website Design